Your Jest Tests are Leaking Memory
Jest is designed in a way that makes memory leaks likely if you’re not actively trying to squash them. For many test suites this isn’t a problem because even if tests leak memory, the tests don’t use enough memory to actually cause a crash. That is, until you add one more test and suddenly the suite comes apart. In this article, we’ll walk through why it’s so easy for Jest to leak memory, how to tell if your tests have a memory leak, and then how to debug and eliminate leaks in your tests. Even if you don’t use Jest, it’s still useful to understand the process in case you need to debug memory leaks in other javascript code.
Why does Jest leak memory?
Jest resets the require cache between each test run. This is really nice because it gives test suites complete isolation from each other. So, even if test suite A requires a module and modifies that module, test suite B can still import that same module and have its own separate copy. However, Jest’s ability to reset the require cache only goes so far - it can’t properly reset native modules like fs or https, for example. If a non-native module that you require decorates or monkey-patches a native module, that module will end up sticking around in memory between tests. Then anything that module references will also stick around in memory, and so on until everything in your entire test suite is floating around in memory after the test finishes. You can find more discussion in this Jest Github issue.
All it takes to trigger your tests to leak is to require a third-party module that decorates a native module anywhere in your code. Error logging / analytics modules tend to do this sort of decorating of native modules, but theoretically any module can do it. So, due to no code that you wrote yourself, your Jest tests can start leaking memory. Of course, you could also monkey-patch a native module somewhere in your own code and also trigger a memory leak.
How can I tell if Jest is leaking memory?
Fortunately it’s easy to tell if your tests are leaking. Run your tests with node --expose-gc ./node_modules/.bin/jest --runInBand --logHeapUsage to report how much memory is being used as your tests run.
I put together a sample app that demostrates this issue at github.com/chanind/jest-memory-leak-demo. The app just consists of a simple express server which requires a 7MB JSON file, imports the geoip-lite module, and includes Sentry for error logging. The JSON file and the geoip-lite module are just included to make the test use more memory so the issue becomes more obvious, but the tests will still leak even without them. The full contents of the app are as follows:
const express = require("express");
// this module uses a lot of memory
const geoip = require("geoip-lite");

// just requiring sentry, not even initializing or using it
require("@sentry/node");

// big-ish file (7 MB)
const enWords = require("./enWords.json");

const app = express();

// return location info about the current user based on their IP
app.get("/ip-to-loc", (req, res) => {
  const ipInfo = geoip.lookup(req.ip);
  res.json(ipInfo || { error: "no ip found" });
});

// return word frequency info based on enWords.json
app.get("/word-freq/:word", (req, res) => {
  res.json({
    word: req.params.word,
    frequency: enWords[req.params.word] || 0
  });
});
Running the tests while logging heap usage shows the following clear memory leak:
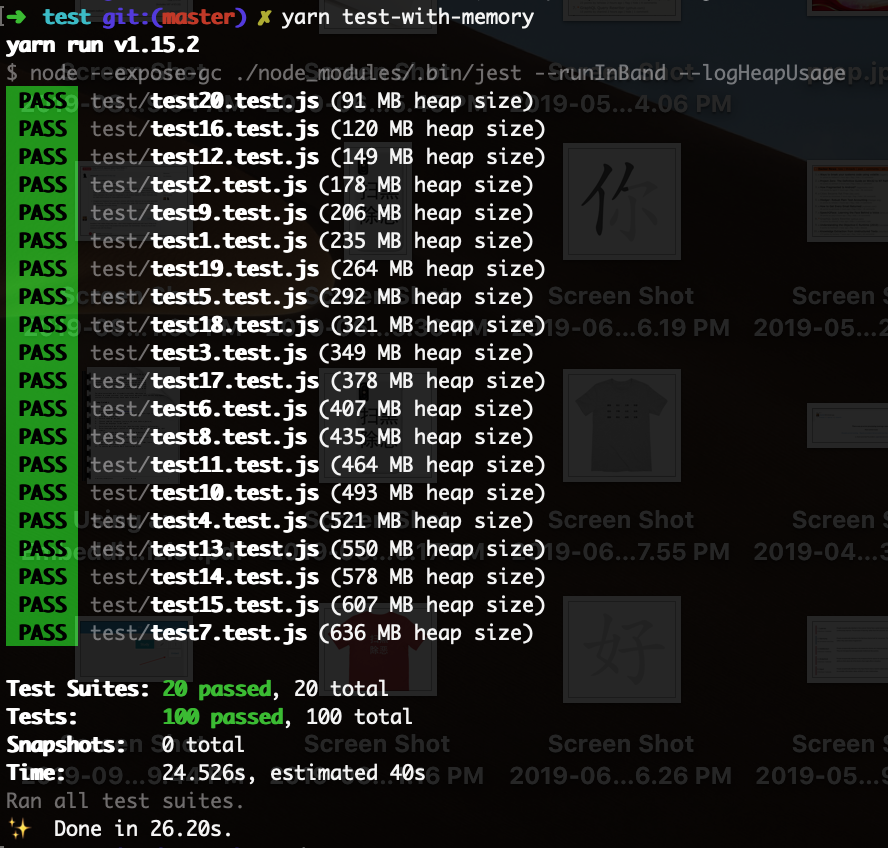
It’s easy to see the memory usage climbing with every test. Every test file leaks about 30mb of memory. If we add more test suites, or if our tests become more memory intensive, this will eventually run out of memory. Can you spot the leak?
Locate the leak
Now that we can see we’re leaking memory, the next step is to find out what’s keeping all this memory hanging around. We can do that using the chrome debugger for Node. We’ll take a heap snapshot using the tool and see where all our memory is going. To do that, start tests with debugging enabled with: node --inspect-brk --expose-gc ./node_modules/.bin/jest --runInBand --logHeapUsage. That will pause the tests when they first start and wait for you to attach the Chrome debugger. Open up Chrome and go to chrome://inspect in the address bar. Click on Open dedicated DevTools for Node to open the debugger.
To start the script executing again, click on the “Console” tab and “Play” to allow the tests to run. After allowing the tests to run for a bit to build up memory we’ll take a heap snapshot. That’s on the “Memory” tab of the debugger.
The heap snapshot can be a bit overwhelming at first glance. The top pane of the snapshot shows everything that’s in memory, and how much memory it’s taking up. “Shallow size” refers to the amount of memory directly held by an object, and “Retained size” refers to the memory taken up by the object and anything the object references. For our case “Shallow size” is the most useful.
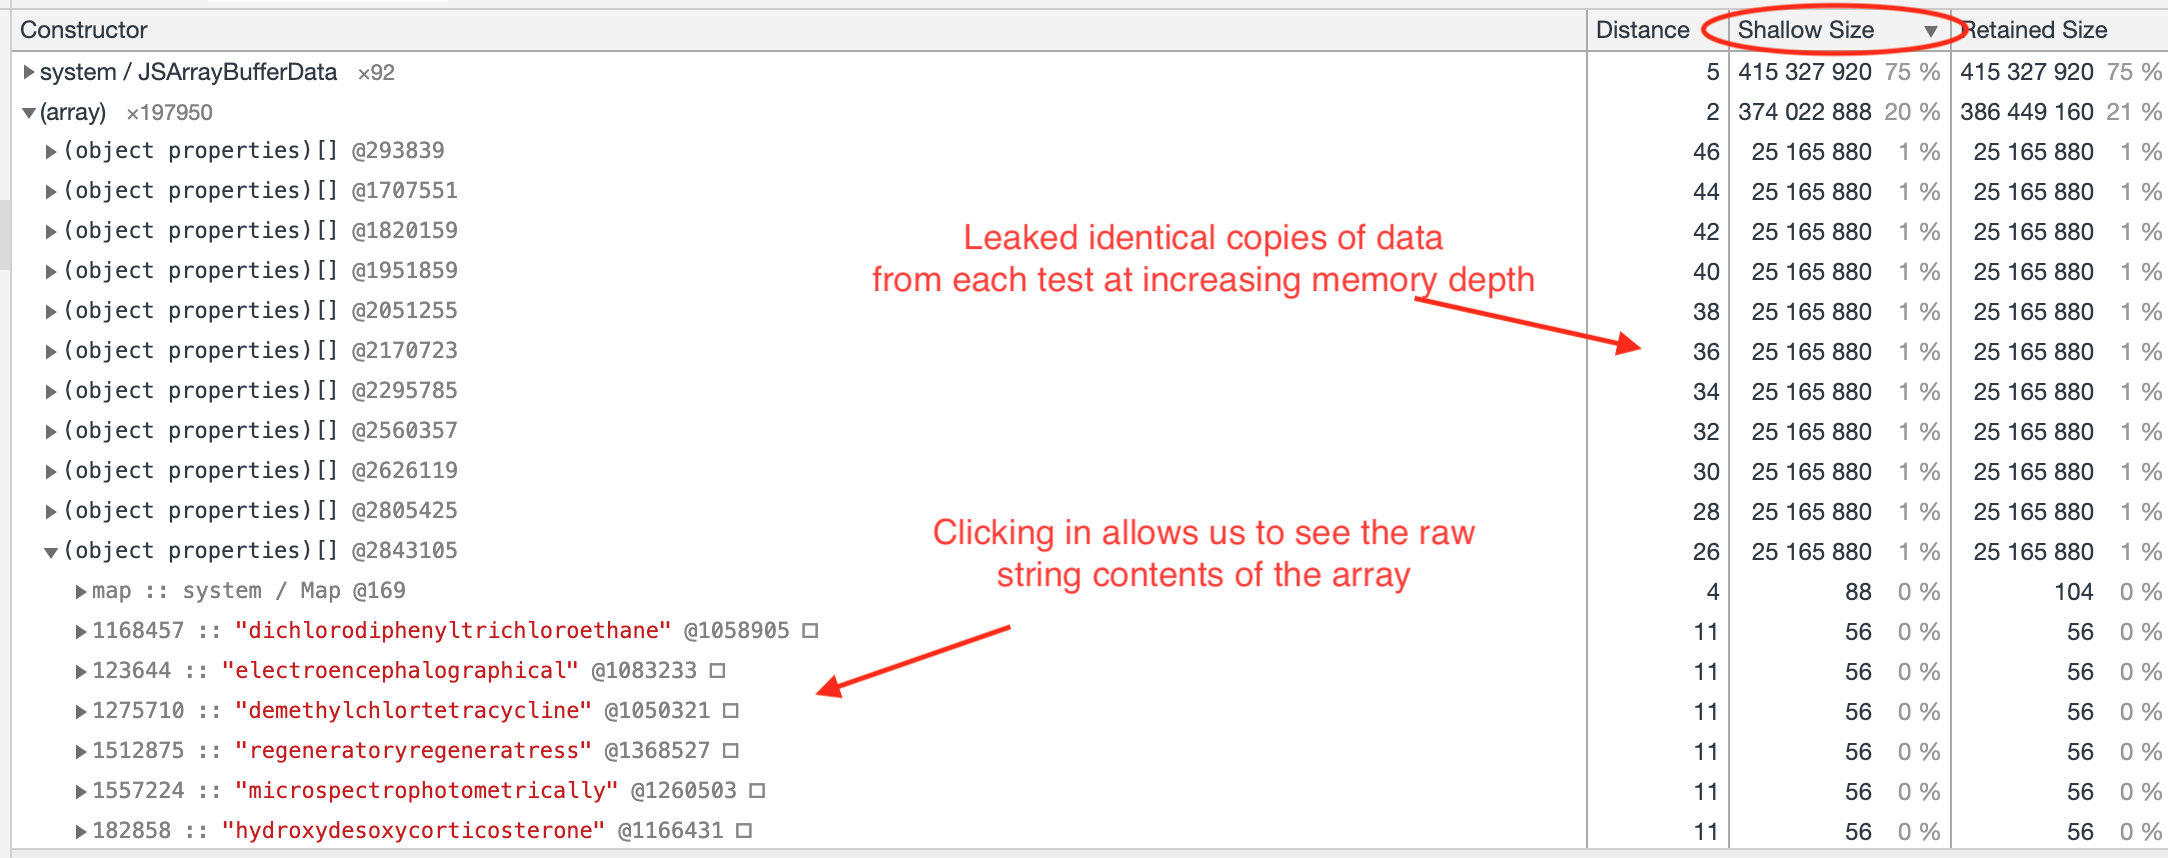
Sorting the objects by “Shallow size” shows us where most of the memory is going. In the case of the demo app, it’s all in JSArrayBufferData and (object properties)[]. The JSArrayBufferData corresponds to the geoip data from the geoip-lite module, and (object properties)[] is the contents of the JSON file of english words that’s being imported in the demo app. If you click into one of the (object properties)[] objects, you can even see the string contents themselves residing in memory, which is pretty cool. It’s also obvious from looking at this that multiple copies of this data are sitting in memory as a result of the memory leak. The copies have the same exact size in memory, but they differ only in terms of their Distance, which is how deep they are in the memory reference tree. Each copy is deeper the the previous copy by 2 memory references. Below you can see the top pane of our heap snapshot with these points labeled.
Now that we can see leaked memory in our heap, the next step is to figure out what’s holding on to it. If you click on an object in the top pane, then the bottom pane shows the whole chain of references that’s holding on to that object keeping it from being released. Clicking on one of the (object properties)[] above we see a reference that looks suspicious:
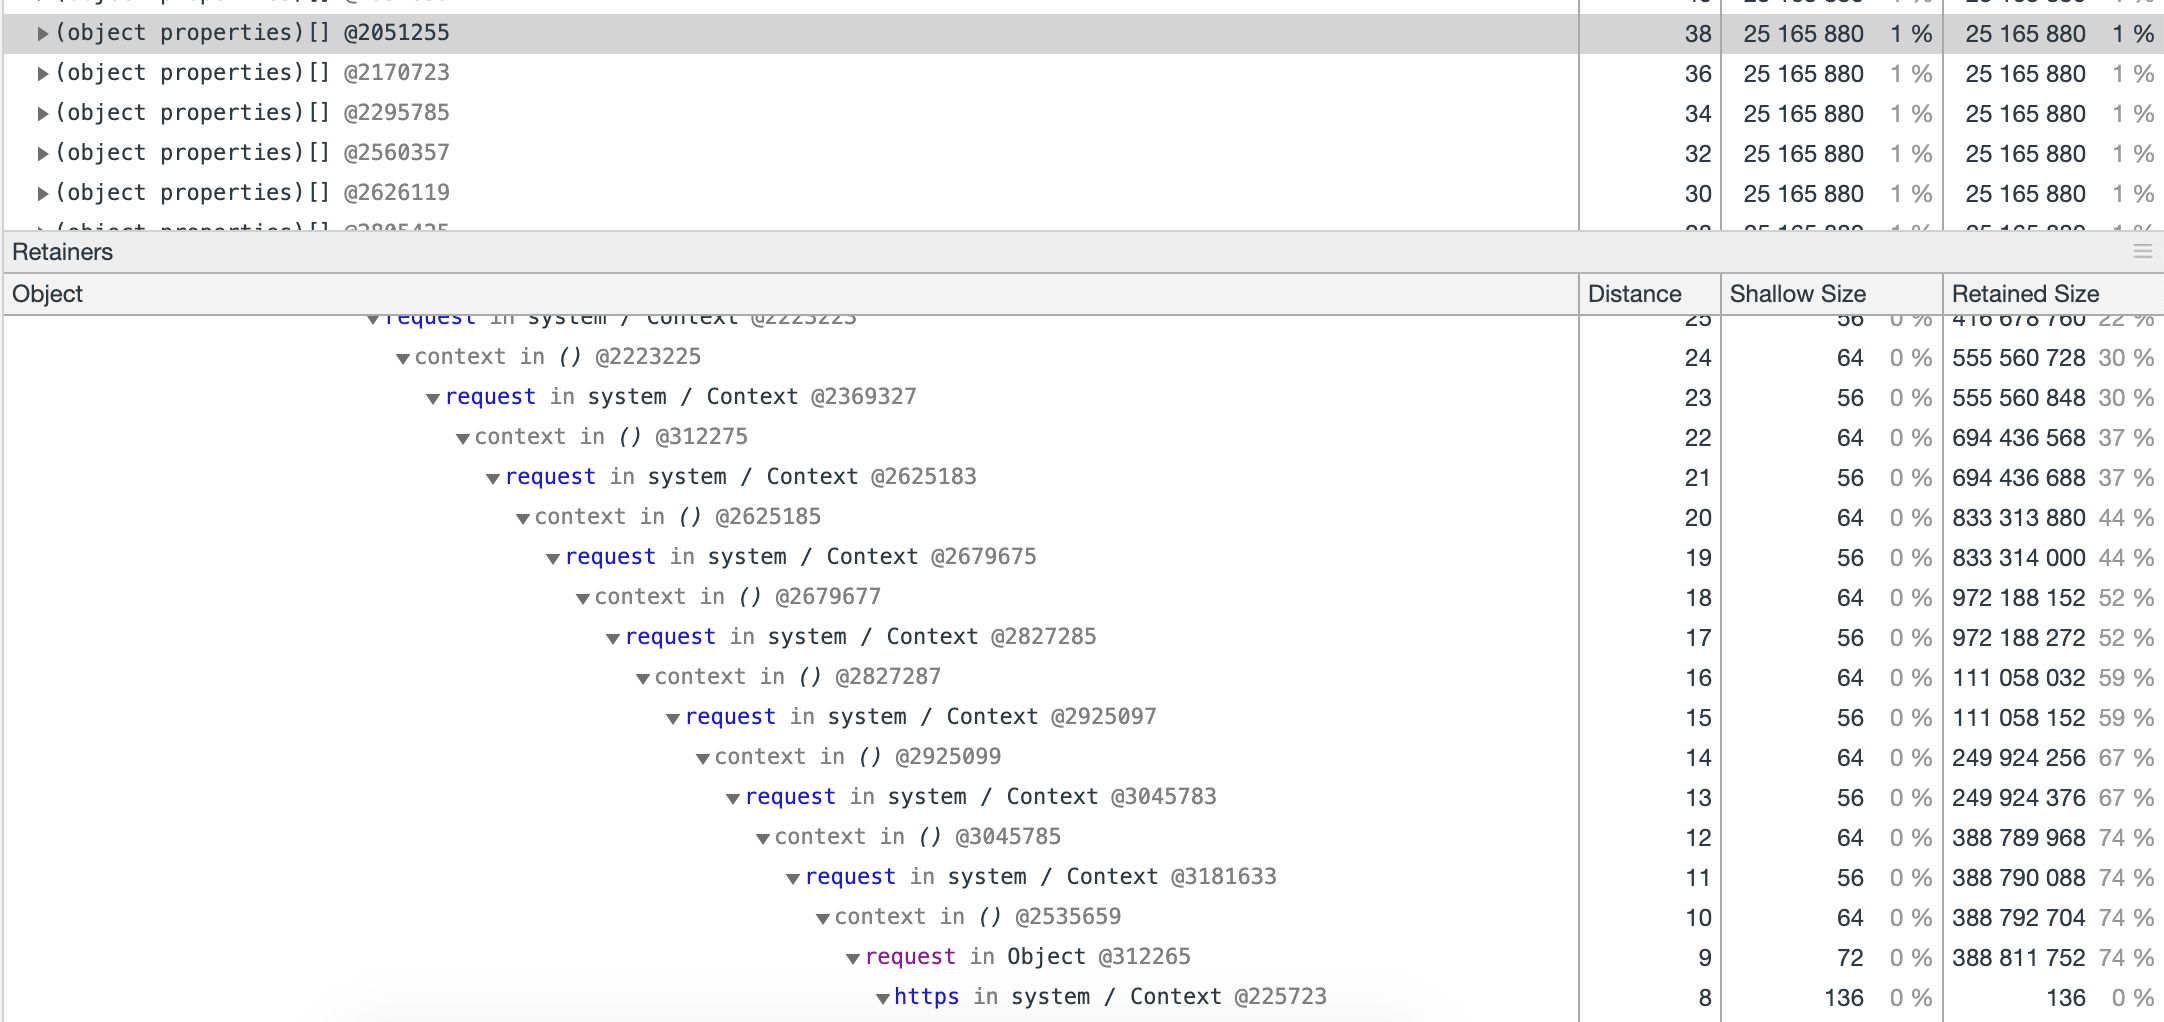
In the bottom pane, there’s a very suspicious chain of request -> closure -> request -> closure -> request etc… holding reference to the leaked memory, with the chain starting at https. It’s a bit of a vague clue, but it looks like something is repeatedly monkey-patching something related to https and request. Sure enough, searching our node_modules folder for https.request leads us to the following patch-core.js file inside of agent-base, where the https module is being monkey-patched on require:
// from agent-base/patch-core.js
https.request = (function(request) {
  return function(_options, cb) {
    let options;
    if (typeof options === "string") {
      options = url.parse(_options);
    } else {
      options = Object.assign({}, _options);
    }
    if (null == options.port) {
      options.port = 443;
    }
    options.secureEndpoint = true;
    return request.call(https, options, cb);
  };
})(https.request);
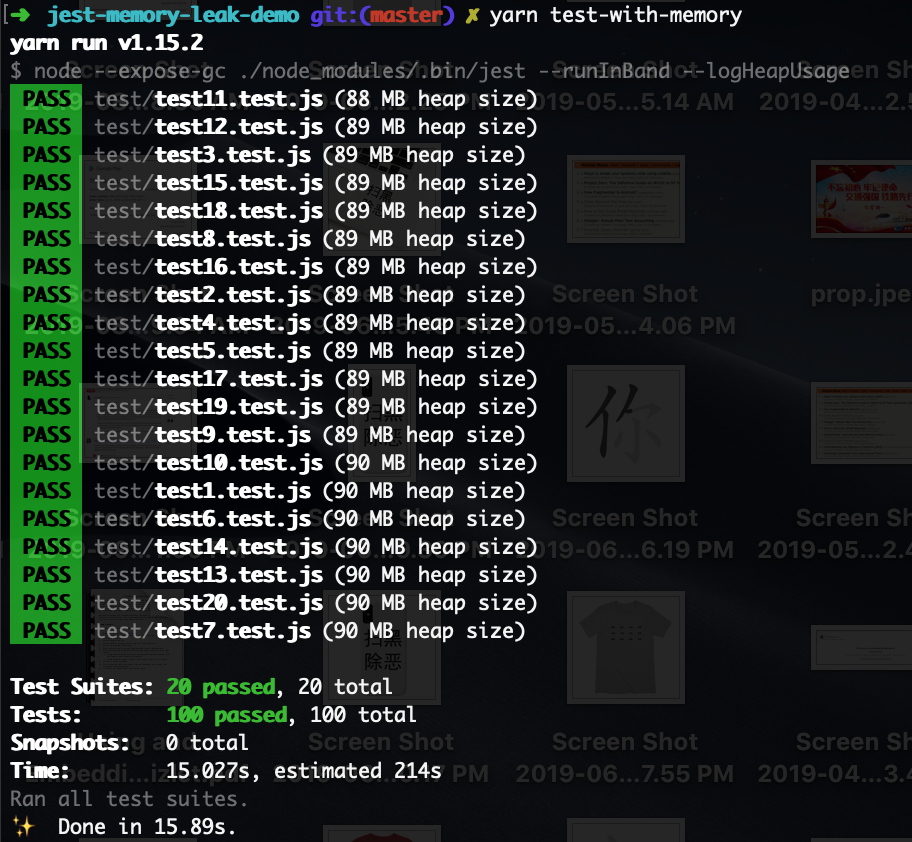
Running yarn why agent-base shows us that agent-base is depended on by @sentry/node, so when we simply ran require('@sentry/node') in the top of our sample app, it requires agent-base which monkey-patches https.request. If we remove require('@sentry/node') from our code, or if we comment-out the code in agent-base/patch-core.js, then re-run our tests, voila, the leak is gone!
The Jest community to the rescue!
Fortunately, this specific memory leak was fixed recently in agent-base in the most recent release (4.3.0 as of this writing), but it’s still useful to illustrate how this sort of Jest memory leak works. The Jest community has started to push fixes for the most common leaky modules, but it’s still very possible to be importing a leaky module somewhere in your code, so it’s important to be aware of this issue for larger codebases that rely on Jest. If you do run into this issue in a third-party module that you use, submit a PR with a fix or at least open up an issue to help others. All it takes is a single module anywhere in your codebase that decorates a native module and your tests will leak memory.
Aside from this issue with potential memory leaks, Jest is an amazing test framework! And even if you do find your tests leaking, the Chrome debugger is all you need to find and fix them.